Hello Everyone!
I hope all is well
Another new post on the blog, this time it is looking at a Max Ball Velocity (MBV) Kick. This was a biomechanic assignment I did with my friend and student at the time, Mr Connuagh Pearce.
I hope all is well
Another new post on the blog, this time it is looking at a Max Ball Velocity (MBV) Kick. This was a biomechanic assignment I did with my friend and student at the time, Mr Connuagh Pearce.
Hope you enjoy reading it
Let me know what you think in the comments!
Like, share and comment!
------------------------------------------------------------------------------------------------------------------------------
**Copyright Disclaimer Under Section 107 of the Copyright Act 1976, allowance is made for 'fair use' for purposes such as criticism, comment, news reporting, teaching, scholarship, and research. Fair use is a use permitted by copyright statute that might otherwise be infringing. Non-profit, educational or personal use tips the balance in favour of fair use**
------------------------------------------------------------------------------------------------------------------------------
The hypothesis for this study was theorised as follows – “There will be
an increase in Max Ball Velocity (MBV) the higher the max acceleration between
Max Back Swing Phase and Ball Contact”. It is postulated that there would be an
expected increase in ball velocity when the acceleration between the max back
swing phase (when the hip is furthest extended) and the ball contact is at its
peak (Apriantono, Nunome, Ikegami & Sano (2006).
Results found through
the use of IBM SPSS Statistics version 21 and Microsoft Excel spreadsheet
programmes, that there was a positive correlation
through the dependent variables of Ball Velocity and Maximum Hip Acceleration,
which defends our initial hypothesis that the noticeable peak in ball velocity
was due to the at least one factor, which includes Max Hip Acceleration (MHA).
Figure 1.0
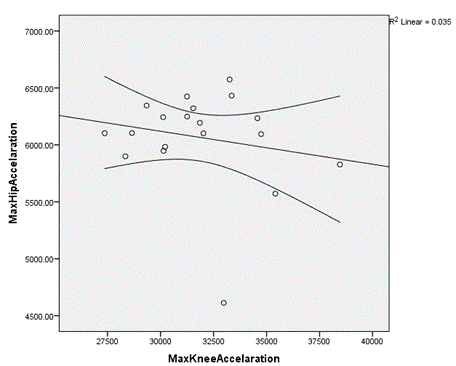 |
Figure 1: A Scatter/dot graph showing the
relationship between Max Hip Acceleration (Flexion) and Max Knee Acceleration (Extension).
Including the 95 % confidence intervals for the mean values.
|
Figure 2.0
 |
Figure 2: Scatter/dot graph showing
relationship between Max Hip Acceleration and Ball Velocity. Including the 95 %
confidence intervals for the mean values.
|
 The graphs show a
positive correlation between Max Hip Acceleration (MHA)
and ball velocity. This can be shown through the line of best fit as the
gradient is positively skewed. The variance of plots is well spread
(homoscedasticity) with the exception of two outliers
- this shows the data to be accurate in the findings. Average MHA
between the max back swing phase and ball contact was 6084.7 ± 94.1 with Ball
Velocity averaging 22.5 ± 0.4. From Figure 1, we can see a negative correlation
showing that when Knee Acceleration increases, Hip Acceleration decreases. This
finding leads us to postulate that a “domino”
effect is occurring - when the hip accelerates in flexion, it will slowly
decelerate due to the lower shank accelerating (e.g. the knee acceleration).
However, a wide spread of scores could causes violation in the data, with few
outliers that can be disregarded. The outliers will be considered as “errors”
due to a number of factors such as human error and extraneous noise.
The graphs show a
positive correlation between Max Hip Acceleration (MHA)
and ball velocity. This can be shown through the line of best fit as the
gradient is positively skewed. The variance of plots is well spread
(homoscedasticity) with the exception of two outliers
- this shows the data to be accurate in the findings. Average MHA
between the max back swing phase and ball contact was 6084.7 ± 94.1 with Ball
Velocity averaging 22.5 ± 0.4. From Figure 1, we can see a negative correlation
showing that when Knee Acceleration increases, Hip Acceleration decreases. This
finding leads us to postulate that a “domino”
effect is occurring - when the hip accelerates in flexion, it will slowly
decelerate due to the lower shank accelerating (e.g. the knee acceleration).
However, a wide spread of scores could causes violation in the data, with few
outliers that can be disregarded. The outliers will be considered as “errors”
due to a number of factors such as human error and extraneous noise.
Figure 3.0
 |
Figure 3: Graph representing the trend
in Hip Acceleration through the 52 frames. Linear Trend Line best represents
the behaviour in MHA showing an overall decrease from start to finish.
|
As can be seen from
Figure 3, the phases analysed and concentrated on were from Back Swing Phase
1-29 (Ball Contact). The range in
error is miniscule compared to the magnitude of values found, showing that even
the range would have little effect on the overall results and initial
hypothesis.
Discussion
The aim of the study was
to find out if there was a positive relationship between hip acceleration and
ball velocity during a maximal leg kick in soccer. From the results gathered,
there was a positive correlation between MBV and hip acceleration. Also found
from Figure 1, upon further investigation on the lower shank, the data showed
that MHA and Max Knee Acceleration (MKA) had a negative correlation, indicating
that an increase in MKA resulted in a reduction in MHA. Reviewing the results
from Figures 1 and 2, it can be shown that 95% of all the data falls within the
range of data within the curved lines (95% confidence interval). This can be
used to make accurate predictions of data unknown. From this we can accept the initial hypothesis
of ‘there will be an increase in Max Ball Velocity (MBV) the higher the max
acceleration between Max Back Swing Phase and Ball Contact”.
Considering the
Biomechanical Characteristics and Determinants of Instep Soccer Kick paper by Kellis & Katis 2007, this summarised that “angular
velocity is maximised first by the thigh, then by the shank and to a lesser
extent, by the activation of the hip muscles. In turn, forward acceleration of
the shank is accomplished through knee extensor moment as well as a motion-dependent
moment from the thigh”. From this extract, we can agree a faster hip angular
acceleration creates a knock on effect to the knee and shank. These findings
from current research defend our hypothesis for Figures 1 & 2. This increase in hip angular acceleration
will lead to a faster maximal velocity kick as the knee flexion acceleration
and shank velocity have increased. The study under investigation only looks at
increasing maximal ball velocity, so accuracy is not taken into account which
is a limitation in a game scenario.
Some studies involving kicking reported very low hip extension values
(Roberts et al., 1974),
whereas others reported high hip flexion (Dorge et al., 1999;
Nunome et al., 2002).
However, some research (Luhtanen, 1988;
Nunome et al., 2002;
Roberts et al., 1974)
reported hip and knee moments. Hip flexion moments reached maximal value at the
end of the backswing whereas maximal knee extension values were observed
immediately after (Nunome et al., 2002).
Finally, ankle moments are generally very low during the first half of the kick
duration and then increase, reaching maximal values at 70-80% of kick duration
(Nunome et al., 2002;
Zernicke and Roberts, 1978).
This would explain how the shank is used during a kick,
as during extension it reaches peak angular acceleration once contact
has been made with the ball.
Reviewing the results
from the study which was conducted at Teesside University and other literature considered
in this report, it can be concluded that the maximal kick in soccer is used for
offensive plays and the team which can have better maximal kicks, are more
likely to score goals and win (Weineck 1997). To score more goals, players need
to be highly coordinated so they can make successful shots count (Newell 1985,
Turvey 1990).
Results of the shank and
hip prove that both play a key role in ball velocity. In essence, if hip
angular acceleration can be increased, this will have a “domino” effect on the
knee and shank. This effect will increase flexion acceleration, which in turn
increases max ball velocity via increased angular velocity of both the knee and
shank. The human body doesn’t work in isolation - it works as one machine, not
in separate parts (Apriantono, Nunome, Ikegami & Sano 2006).
Some factors affecting
kicking performance include strength of subjects, experience, age, style of
kicking, environment (wet/dry/indoors/outdoors), footwear, post injury, and
presence of others (Hawthorn Effect).
Motor
Control Section
The aim of this
experiment was “Does self-selecting a schedule for video feedback (Knowledge of
Performance) enhance kicking accuracy in football? “. The hypotheses of this
study included;
- Null
Hypothesis: There will be no significant difference between the Yoke group and
Self-Selected group between the mean score at retention and transfer tests.
- One
Tailed Hypothesis: The Self-Selected group would have a significantly better
mean score at retention and transfer tests.
- Alternative
Hypothesis: There will be a significant difference between the Yoke group and
Self-Selected group between the mean score at retention and transfer tests
The Self-Selected group
performed better overall over the three time points (EOA, 24HR, TT). The
interaction between groups showed both started off at the same level of
accuracy (points scored) however, the experimental group improved accuracy at a
higher rate i.e. steeper gradient.
Results
The results for this
study were found using the two-way mixed measures ANOVA. This test combines Between (Independent) and
Within (Repeated) Subjects. The mixed measures combine these subjects to find
an interaction effect between the IVs (Yoked and Self-Selected group) and DV
(hitting the football target). In this method of ANOVA, there are 2 IVs included and 1 DV, Group x 2
and Time points x 4 and can be listed as a 4 x 2 Mixed ANOVA. The ANOVA test is
split into 2 sections - the omnibus test (showed whether there is a significant
difference, but not where the interaction lies) and the post hoc (this showed
specifically where the interaction lies). The omnibus test showed overall
accuracy scores were significantly higher in Self-Selected than Yoked, (31.4,
21.55) and a significant main effect of the ‘Two-Way Interaction’: F (3,54)=
6.026; P≤0.01; n=0.251 meaning there was an interaction somewhere between the
groups mean scores in the time points. Comparisons also showed every time point
was significantly different from each other, thus supporting these findings. The
null hypothesis therefore can be rejected and we can accept either the one
tailed or alternate hypothesis. Also tested was the significance of the groups
- Within Subjects: F (3.34) =63.76; P<0.01; n=0.78, Between Subjects: F (1,
18) = 75.439; P<0.01; n=0.807.
A follow up test
Independent samples T-test was conducted to find where the interaction lay. At first, it revealed no significant
difference between accuracy scores of Yoked & Self-Selected. However, more
importantly, it showed a significant difference between accuracy scores at both
‘Retention’ and ‘Transfer’ Tests (Both p’s ≤ 0.001). Figure 1 below represents
each 4 time points and mean scores of both groups. The graph shows that the
interaction at pre-test to EOA (End of Acquisition). The Experimental Group
(EG) performed a higher mean score and improved in accuracy at a faster rate
than the Yoked group. Also, the EG
maintained the condition of given feedback as a slow but minor decrease in mean
score outcome.
Figure 4.0
 |
| Figure 4.0: This is a graph showing the mean
scores of both Experimental Group (EG) and Yoked Group (YG) at each of the four
times points, (Pre-Test, End of Acquisition, 24hr- retention test and Transfer
Test) including variance scores |
From the findings we can
accept the One Tailed Hypothesis of “The Self-Selected group would have a
significantly better mean score at retention and transfer tests” as a result of
the Post Hoc test.
Comparison Studies
The 2002 Chiviacowsky and
Wulf study included 30 subjects (18 men and 12 women). The task required
subjects to press 4 keys in a prescribed temporal sequence. Subjects had no
previous experience with the protocol and groups were randomly assigned, either
Yoked or Self-Control with Yoke being paired to same sex.
They were informed to
request feedback only when they thought they needed it and that they would
eventually have to perform the task without feedback. After trials, participants
were requested to fill out a questionnaire asking why they asked for constructive
criticism. The results showed that learners based their decisions to request or
not request feedback on their performance on a given trial with preferences given
to supposedly good trials. It is clear
that Yoked learners did not have the advantage of feedback being provided, and
this might explain the advantages of Self-Controlled practice in this study
compared to previous research. The majority of Self-Controlled participants
asked for feedback 67% of the time when they thought they had a good trial.
Review of the Wulf,
Raupach & Pfeiffer (2005) paper on Self Controlled Observational Practice
Enhancing Learning, demonstrated that Self-Controlled practice can benefit the
effectiveness of motor skill learning. The study had 26 participants (10 women
and 16 men) and used basketball as subjects were unfamiliar with the task of
performing a jump shot. Groups were randomly assigned to either Yoked or Self-Control,
with Yoked being paired to same sex. Results showed that the Self-Control group
asked for the presentation of video 1.5 times on average and more
demonstrations were relatively early in the task and less towards the end. The
Yoked group had a higher skill level at the beginning of practice, however, the
Self-Controlled group demonstrated greater improvement in movement from
relative to yoked participants. In retention tests, the Yoked group demonstrated
a drop in performance from the end of practice to the beginning of retention. Self-Controlled
practice might have beneficial influences on learning e.g. through increased
motivation and a more active involvement in the learning process (Bandura,
1993). Overall, the Self-Controlled group had higher form scores than the Yoked
group. This shows that Self-Selecting is more effective in the long-term gains than
a prescribed feedback, which relates positively to the results of this study.
The Guidance Hypothesis
states that too much feedback can be detrimental to learning (Salmoni, Schmidt
and Walter 1984). This hypothesis states that even though recurrent feedback
provided during practice is beneficial to the learner, in order to choose the
correct responses, it blocks the processing of other sources of important
information that are essential in order to obtain an internal depiction of the
movement task that is capable of generating the movement when the feedback is stopped.
The reasoning for this is because those
individuals who choose a Self-Selected approach to learning, will learn at
their own rate. However, if information is overloaded, they can’t process the
information as efficiently, which is what the guidance hypothesis explains.
Limitations of this study
can be related to the participants used. This study used novice footballers on
their non-dominant foot. This is unfair
as in a real game, most footballers (semi-pro/professional) can play with
either feet, thus meaning higher accuracy in both feet. This undermines the nature of the study.
Another limitation regarding the method can be the velocity of the kick. The requirement was to kick the ball as hard
as possible. However, again in a real game situation, power may not be key to
hitting the target.
To improve this study,
the use of professionals and the possibility of a case study instead of a
population study, may prove more effective. Also, if a participants study was
used, more subjects could be considered to increase the accuracy of results. Likewise,
for coaches to apply Self-Selected learning style, they should be aware of
whether their learners are in control of their feedback, e.g. for motivational
reasons and/or provided by an external source, e.g. a coach. These need to be
understood so participants can benefit in a self-controlled practice, as this
can inhibit the use of the feedback.
Link between Motor
Control and Biomechanics
By evaluating the
biomechanics and motor control research studies, we can conclude that
biomechanically there is an obvious domino effect (hip, knee and shank) through
the transfer of force. Coaches can analyse the physiological data (velocity,
power output & acceleration) to instruct athletes to achieve a maximal
velocity kick without wasting this generated energy. Biomechanically, subjects’
movements can be tracked using a point-light-display combined with a sports
specific task to generate real-world data which can be applied e.g.
professional football players taking free-kicks. Limitations that differ from
the motor control study include the number of participants - the biomechanics
study had only 1 participant whereas the motor control study involving 20 which
can lead to trends in data and provide more efficient benefits for a wider
population. Another drawback was that there was no target. This differs from both studies as there was a
target to aim for in the motor control study.
This can cause drawbacks as we don’t know how hard the kick was being
performed. We cannot draw any association between the studies based on the
velocity of the kick as the participants in the accuracy study may have been
kicking as hard as they could (as instructed) to achieve the best possible
accuracy scores.
Analysing the motor
control research it can be agreed that Self-Selected feedback is the preferred
way of independent learning as confirmed by the literature. Self-Selected
feedback could have enhanced performance in the max velocity kick, depending on
the advice received. From the results found, the further back the hip was
extended and propelled forward to ball contact, the higher the max ball
velocity would produce. From Self-Selected feedback, the participant could have
asked for constructive criticism from a coach which
would have produced significantly improved results if instructed to produce
higher force from the hip extension phase to ball contact. This is due to the earlier referred to “domino
effect” in that the increase in acceleration
of the hip, leads to the increased velocity of the knee (it would be in flexion
to come in contact with the ball). An additional alternative method to the
motor control study to increase accuracy and reliability of the study, could be
to use eye-tracking methods as distraction of surroundings could inhibit
performance, therefore producing invalid results.
Regardless of the
methodology the following is proposed; each subject will provide their own
subjected feedback through the use of the Borg RPE scale (Borg 1998). This will
quantify each individual’s own effort and should correlate to any physiological
markers e.g. 10 RPE (Rate of Perceived Exertion) scale would equate to maximal
force for a free kick. This would succinctly combine both motor control and
biomechanics fields to produce a higher quality of Human Movement in future
research.
References
1. Apriantono, T., Nunome, H.,
Ikegami, Y., & Sano, S. (2006). The
effect of muscle fatigue on instep kicking kinetics and kinematics in
association football. Journal of Sports Sciences, 24(9), 951-960.
2.
Bandura,
A. (1993). Perceived self-efficacy in
cognitive development and functioning. Educational Psychologist, 28, 117-148.
3.
Borg's
Perceived Exertion and Pain Scales. Champaign, IL: Human Kinetics; 1998
4.
Chiviacowsky.
S & Wulf. G (2002). Self-Controlled
Feedback: Does it Enhance Learning because Performers get Feedback when they
need it? Research Quarterly For Exercise and Sport. 73, 408-415.
5.
Dorge
H., Bull-Anderson T., Sorensen H., Simonsen E., Aagaard H., Dyhre Poulsen P.,
Klausen K. (1999). EMG activity of the
iliopsoas muscle and leg kinetics during the soccer place kick.
Scandinavian Journal of Medicine and Science in Sports 9, 155-200.
6.
Huang
T., Roberts E., Youm Y (1982) Biomechanics
of kicking. In: Human body dynamics: Impact, occupational, and athletic aspects.
Ed: Ghista D, editor. Oxford: Clarendon Press; 407-443.
7.
Janelle.
C. M, Barba. D. A, Frechlich. S. G, Tennant. L. K & Cauraugh. J. H (1997). Maximizing Performance Effectiveness through
videotape replay & a self-controlled learning environment. Research
Quarterly for Exercise & Sport 68, 269-279.
8.
Janelle.
C. M, Kim. J & Springer. R. N (1995). Subject-Controlled
Performance Feedback & Learning of a Closed Motor Skill. Perceptual
& Motor Skills. 81, 627-634.
9.
Kellis,
E., & Katis, A. (2007). Biomechanical Characteristics and Determinants of
Instep Soccer Kick. Journal of Sports Science & Medicine, 6(2),
154–165.
10.
Lees
A., Nolan L. (1998). The biomechanics of soccer: A review. Journal of Sports
Sciences 16, 211-234.
11.
Levanon J., Dapena J. (1998) Comparison of the kinematics of the full-instep and pass kicks in
soccer. Medicine and Science in Sports and Exercise 30, 917-927.
12. Luhtanen P. (1988). Kinematics
and kinetics of maximal instep kicking in junior soccer players. In:
Science and Football. Eds: Reilly T., Lees, Davids K, Murphy, W.J., Editors.
London: E & FN Spon; 441-448.
13. Nunome H., Asai T., Ikegami Y., Sakurai S (2002). Three Dimensional kinetic analysis of side
foot and instep soccer kicks. Medicine and Science in Sports and Exercise
34, 2028-2036.
14. Putnam C. (1991). A
segment interaction analysis of proximal-to-distal sequential segment motion
patterns. Medicine and Science in Sports and Exercise 23, 130-141.
15. Roberts E., Zernicke R., Youm Y., Huang T. (1974). Kinetic Parameters of kicking. In:
Biomechanics IV. Eds: Nelson R., Morehouse, C., editors. Baltimore: University
Park Press; 157-162.
16. Weineck J. (1997) Fuβballtraining. Teil 1:
Konditionstraining des Fussballspielers. Perimed: Spitta y
17. Wulf G & Shea. C. H (2002). Principles derived from the study of simple motor skills do not
generalize to complex still learning. Psychonomine Bulletin & Review 9,
185-211.
18. Zernicke R., Roberts
E.M. (1978). Lower extremity forces and
torques during systematic variation of non-weight bearing motion
---------------------------------------------------------------------------------------------------------------------

---------------------------------------------------------------------------------------------------------------------
Andrew Richardson, Founder of Strength is Never a Weakness Blog

I have a BSc (Hons) in Applied Sport Science and a Merit in my MSc in Sport and Exercise Science and I passed my PGCE at Teesside University.
Now I will be commencing my PhD into "Investigating Sedentary Lifestyles of the Tees Valley" this October 2019.
I am employed by Teesside University Sport and WellBeing Department as a PT/Fitness Instructor.
My long term goal is to become a Sport Science and/or Sport and Exercise Lecturer. I am also keen to contribute to academia via continued research in a quest for new knowledge.
My most recent publications:
My passion is for Sport Science which has led to additional interests incorporating Sports Psychology, Body Dysmorphia, AAS, Doping and Strength and Conditioning.
Within these respective fields, I have a passion for Strength Training, Fitness Testing, Periodisation and Tapering.
I write for numerous websites across the UK and Ireland including my own blog Strength is Never a Weakness.

I had my own business for providing training plans for teams and athletes.
I was one of the Irish National Coaches for Powerlifting, and have attained two 3rd places at the first World University Championships,
in Belarus in July 2016.Feel free to email me or call me as I am always looking for the next challenge.
Contact details below;
Facebook: Andrew Richardson (search for)
Facebook Page: @StrengthisNeveraWeakness
Twitter: @arichie17
Instagram: @arichiepowerlifting
Snapchat: @andypowerlifter
Email: a.s.richardson@tees.ac.uk
Linkedin: https://www.linkedin.com/in/andrew-richardson-b0039278
Research Gate: https://www.researchgate.net/profile/Andrew_Richardson7
No comments:
Post a Comment